Why Slick

recurring challenges

Setting and managing budget as parameters and goalposts change
Tracking performance in a dynamic environment
Making sure resources and skills are used efficiency
Maintaining compliance
Controlling investments and managing risks
Ensuring profitability
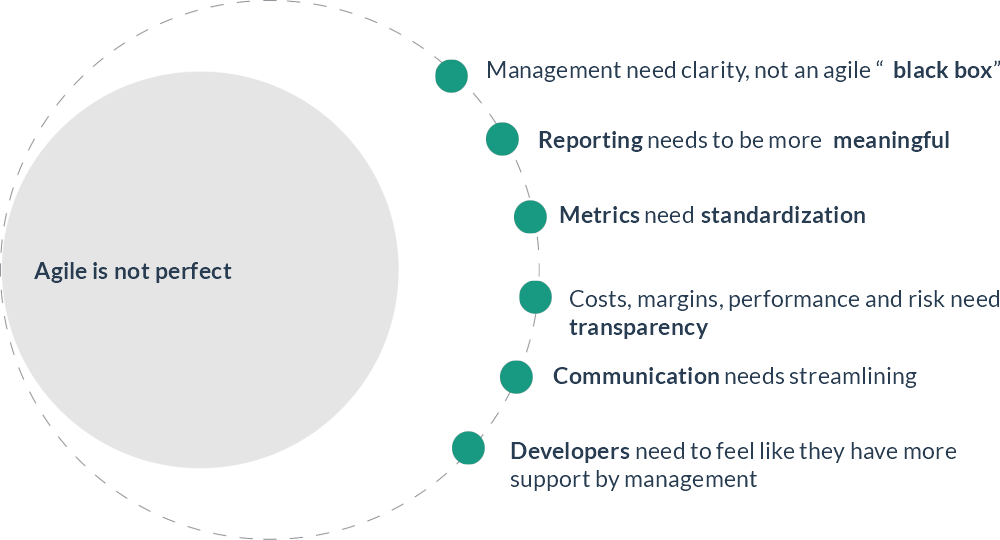
a new beginning

Agile has enabled teams to be more flexible in a highly dynamic environment, helping tackle:

  • Poorly defined requirements
  • Changing variables

the landscape today

90% of tech companies claim to use the agile methodology…

… but 75% are failing to implement it to satisfaction

Deloitte Rewriting the rules for the digital age 2017 Deloitte Global Human Capital Trends

US Department of Defence DIB Guide: Detecting Agile BS Version 0.4, last modified 3 Oct 2018

what needs to change?

strumenti innovativi processi agile
Tools and best practices that dovetail with Agile, aligning
  technical development to financials so you can monitor
costs and results in real-time

why Slick®

Clarity

Complete transparency on performance, risk and costs, with easy root cause analysis for any issues

Collaboration

No more tension between developers and managers because of difficulty managing communication, budgets and timescales

Cost-Effectiveness

Easily evaluate margins and manage budgets, so you can control spend in real time

how Slick® works

a straightforward add-on to Agile

Slick Core People Company

Slick® Core

Slick Core People Company

Slick® Core

benefit: easily manage project status, spend and sustainability

Real-time milestone and budget tracking, accounting for continual evolution
Managers can extract information without relying on developer updates
See how decisions affect budget so you can manage objectives and requirement changes
Early pivoting –it’s easier to change before it’s too late
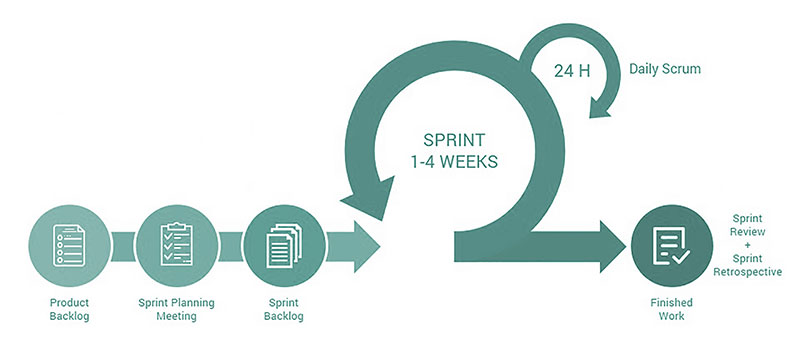
Slick® Core

how it works

Slick® tools help you monitor progress, set realistic milestones, manage requirement changes and controlcosts

Log Creation

Defineallthe project stories and make team estimation

Index monitoring

Cost to Budget index CB
Project status
Effort to Budget index EB
Estimate error
Team overall Effort index TE
Team performance

Slick chart evaluation

Based on a traffic-light system, showing at a glance if the project is on track and helping you pinpoint the cause of any bottlenecks

Slick® Core

using the indices and charts to shape your approach

Cost to Budget index CB
Project status

CB=EB x TE
CB = Effort to Budget X Team overall Effort

CB is the main index and could be >1, <1 =1

Thanks to data collected, a point shows up in the chart every sprint (1-6 weeks long). The background color behind the point describes the project’s health: green is safe, yellow, red, orange is in danger.

Slick® Core

using the indices and charts to shape your approach

Slick Chart

Cost to Budget index CB
Project status

CB=EB x TE
CB = Effort to Budget X Team overall Effort

Case CB <1
Your project is healthy

Slick® Core

using the indices and charts to shape your approach

Slick Chart

Cost to Budget index CB
Project status

CB=EB x TE
CB = Effort to Budget X Team overall Effort

Case CB >1
Your project status is in danger… you need to investigate more

  • Talk to investors
  • Improve team performance
  • Reduce uncertainty
  • Limit flexibility

Slick® Core

using the indices and charts to shape your approach

Slick Chart

Cost to Budget index CB
Project status

CB=EB x TE
CB = Effort to Budget X Team overall Effort

Green is safe, yellow means underperforming team, orange means insufficient budget, red means both the problems.

budget_excess

Budget Excess

team_critical

Team Critical

team_budget_critical

Team Critical - Budget Critical

budget_critical

Budget Critical

Slick® People

Slick Core People Company

Slick® People

benefit: easily monitor team resource and skills to motivate staff and achieve project goals

Build teams with exactly the right skills mix
Define roles and responsibilities in a fluid environment
Allocate resource based on accurate, real-time requirements
Set personal growth objectives
Collect and monitor performance data
Create quantitative performance records to eliminate bias and inform benefit and bonus policies

Slick® People

how it works

Slick tools help you allocate responsibilities, foster collaboration and reward success

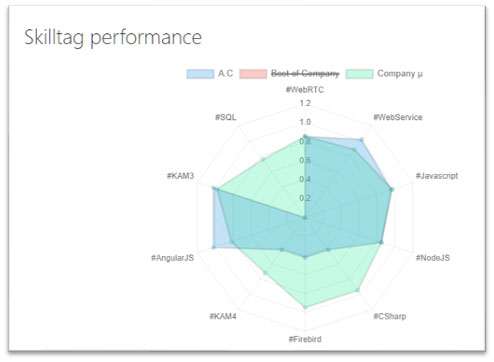
Roles and responsibilities

PL
Project Leader
DES
Designer
DEV
Developer

Skill tags

Define the skills and expertise required for each element


Tag project with main skills
Tag stories with specific skills

Personal skills record

Track people’s evolving skillsets


Easily review skill tags and
related performance

Slick® Skill Dashboard

Slick® Company

Slick® Company

benefit: leaders can easily manage a project portfolio –and evaluate company performance

Make informed choices over a wide project portfolio to optimize overall performance
Track project changes and budget impact
Manage people and resource across different projects
Delegate team allocations based on resource and skill requirements
Manage company knowledge and IP in a structured, quantitative way

Slick® Company

how it works

Slick tools help you understand business, project and staff performance

Fluid resource allocation

Allocate resources to evolving projects, with people in multiple projects concurrently


Select the most qualified team based on objective skills data

Real-time business monitoring

Collate indices from every projects

Analyze load and margin in real-time

Make informed strategic decisions

In-depth skills insight

Collect skills data from every project

Automate building of knowledge base

See how the company’s skills and knowledge base are changing in real-time

Scroll to Top

We use cookies to personalise content and ads, analyse our traffic and share information about your use of our site with these partners.
By clicking CLOSE you will allow our use of cookies. You may read more about any of the purposes, features or vendors that we use and how to manage your consent by clicking here.

Verified by MonsterInsights